Updated:
You can spend all day answering this question, but estimating keyword volume is the best way to start.
Do you ever wonder how many people would find your website if you ranked for a keyword? Or, how much traffic your competitors get by ranking above you on the Google results page? Answering these questions is an important part of evaluating your SEO investment and there is a vast universe of metrics that will help. To get a quick preview, you can estimate keyword volume and here are a few things you should know about that process.
Estimating Keyword Volume
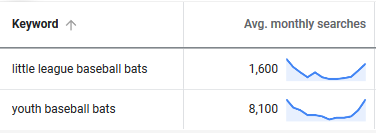
Keyword Volume (a.k.a. Search Volume) is a measure of how many people will use Google to search for a given keyword within a given timeframe. And Google’s Keyword Planner will give you basic estimates in a few seconds, as seen below.
To hone this information further, you can measure several keywords and aggregate the results. If you do this, be sure to pick keywords with the same intention (e.g. people want to buy a specific item, learn about the same thing, or find a specific service). In the baseball bats example, both keywords have the same intention and can be grouped together. A mismatch would be something like “youth baseball bat regulations.”
It is important to note that Keyword Planner is not a perfect tool. Keywords with consistent search volume occasionally show a value of zero in the “Monthly Searches” column. There are ways to get around this situation, but I will leave that for another post.
Considering Seasonality
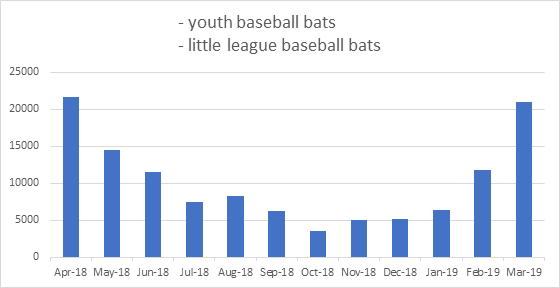
Numbers provided by Keyword Planner represent the average for a given timeframe (the default is one year; the maximum is 36 months). To make this information more valuable, factor in the concept of seasonality. Many keywords, such as the ones in the baseball bat example, have distinct trends. If you look at the chart below, you will see that the number of monthly searches rises past 20,000 in March and April but drops to less than 3,500 in October.
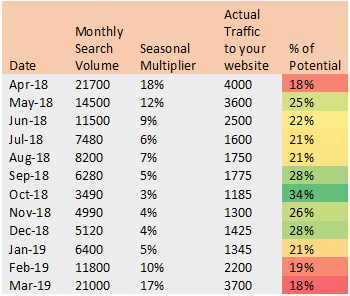
So, if a website got 3,300 visitors in October and was using the average monthly search volume of 10,205 to calculate traffic, it would look like the site got 34% of the potential. In reality, it got almost 95% (not bad).
To create your own multiplier, use this simple formula:
The chart below uses the baseball bat example to illustrate seasonality’s impact on site performance. Notice that the highest percentage of potential was actually the lowest volume month of the season. Conversely, the highest volume months have the lowest percentage of potential.
If you need to find out more information about the keywords that are most relevant for your website, try using Google Search Console. It provides detailed information on impressions, clicks, ranking position, device type, country, and impression type (i.e. web, image, or video).
In my next post, I will discuss Click-Through Rate by Ranking Position—another simple way to measure and understand how Google Rank affects your website and your bottom line.


