PRODUCT: CORE WEB VITALS AUDIT REPORT
In May, Google will launch a highly anticipated algorithm update. It will introduce Core Web Vitals and significantly increase the impact of user experience (UX) on search performance. If you want to benefit from this change, you will need to make sure that your website meets all of the new thresholds.
Our Core Web Vitals report will help you prepare by identifying trouble spots on your website and recommending specific corrective action. With our technology, you can get a comprehensive task list for your development team in just a day or two.


What are Core Web Vitals and why are they so important?
Google has identified the most important UX metrics for websites and labeled them Core Web Vitals. These metrics represent the first phase of Google’s next big algorithm update. Core Web Vitals cover three major aspects of user experience: Loading, Interactivity, and Visual Stability. In Google’s words, they “apply to all web pages, should be measured by all web owners, and will be surfaced across all Google tools.”
Understanding how Core Web Vitals apply to your website is the first and best step toward mitigating (or capitalizing on) SEO impact. According to a recent study, a small percentage (<15%) of existing websites would meet the minimum threshhold for all three Core Web Vitals.
What is included in FourFront’s report?
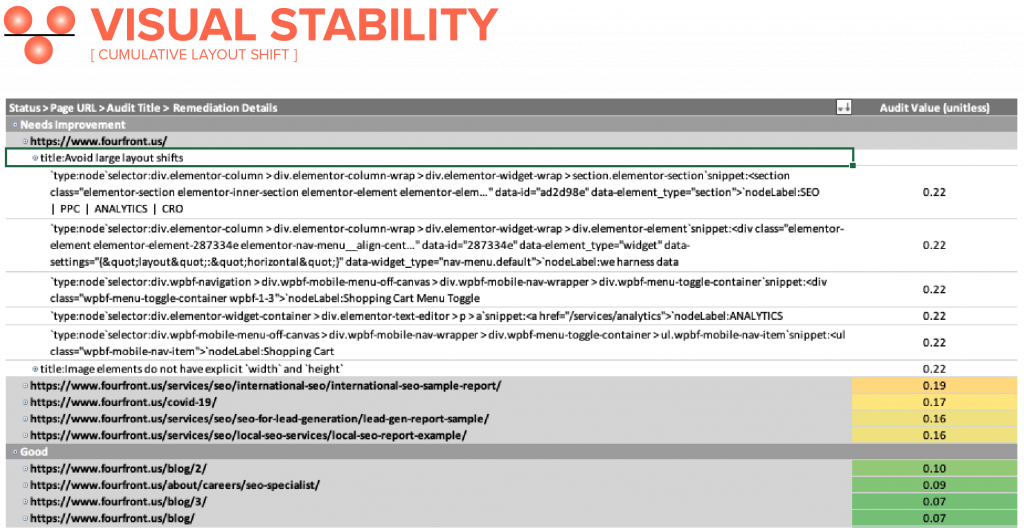
Our report provides page-level data pertaining to all Core Web Vitals (see samples below). It also provides recommendations for remediation (sourced directly from Google) for every metric with a score of “Needs Improvement” or “Poor.” The report is designed for your development team and can be used to quickly resolve potential issues.


Why FourFront?
We are a top-rated SEO company and Google Certified Partner with over ten years of experience helping a wide range of clients improve website performance. Our team includes researchers and analysts who leverage data science techniques as well as communicators and report engineers who excel at coordinating, visualizing, and presenting data.


